
Statistical Process Control (SPC) monitors and controls manufacturing and business processes using statistical methods to maintain consistent quality and reduce variability.
SPC applies data-driven techniques to track process performance in real time. Organisations deploy it to detect deviations before they impact output. In corporate settings, HR managers and L&D professionals integrate SPC training to address skill gaps in quality management teams.
is evident in a 20-30% reduction in defects across
SPC distinguishes common cause variation natural fluctuations from special cause variation assignable anomalies. Control charts plot data points against upper and lower control limits, typically set at three standard deviations from the mean. Points outside limits signal action needs.
How Does Statistical Process Control Integrate with Six Sigma in Workforce Training?
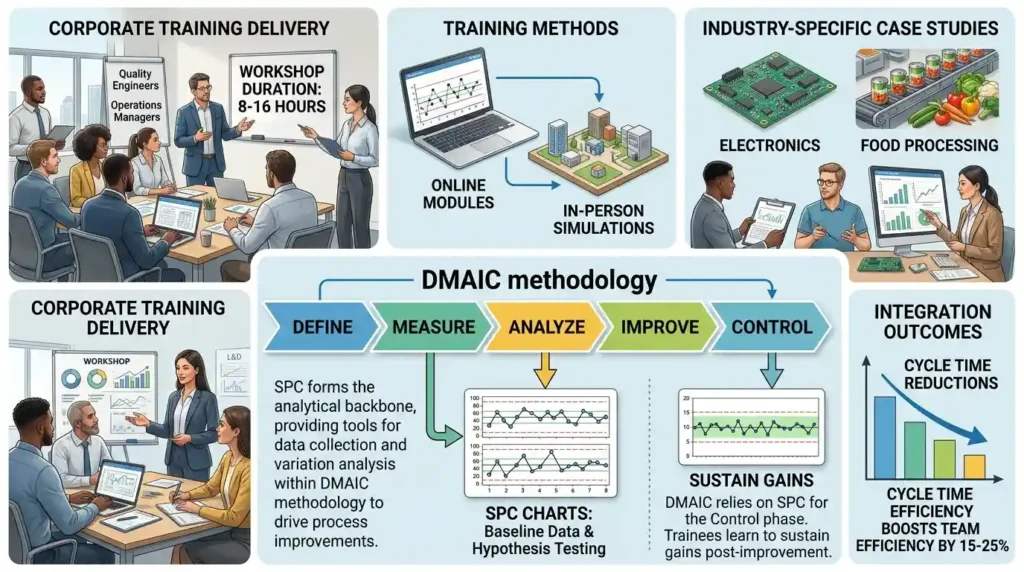
SPC forms the analytical backbone of Six Sigma, providing tools for data collection and variation analysis within DMAIC methodology to drive process improvements.
Six Sigma employs SPC in the Measure and Analyse phases. Training programs teach professionals to use SPC charts for baseline data and hypothesis testing. Corporate training delivers this through workshops lasting 8-16 hours, focusing on real datasets.
In organisations, L&D teams roll out Six Sigma training incorporating SPC to upskill quality engineers and operations managers. Hybrid formats combine online modules with in-person simulations. Participants analyse case studies from sectors like electronics and food processing.
DMAIC, Define, Measure, Analyse, Improve, Control relies on SPC for the Control phase. Trainees learn to sustain gains post-improvement. This integration boosts team efficiency by 15-25%, as measured by cycle time reductions.
How Does Statistical Process Control Work Step by Step in Corporate Environments?
SPC operates through seven steps: data collection, chart selection, limit calculation, plotting, analysis, correction, and monitoring to ensure process stability.
Step 1: Collect data from key process variables, sampling 20-50 units per subgroup over 25 subgroups. Quality teams use automated sensors in factories.
Step 2: Select appropriate control charts—X-bar and R for variables, p-chart for attributes. Training covers selection via decision trees in 4-hour modules.
Step 3: Calculate control limits using formulas like Xˉ±3d2Rˉ for X-bar charts, where d2 is a constant from statistical tables.
Step 4: Plot data points and centreline on charts. Software like Minitab automates this in corporate deployments.
Step 5: Analyse patterns run, trends, or out-of-control signals using Western Electric rules. Seven points in a row on one side of the centreline triggers review.
Step 6: Correct special causes with root cause analysis tools like fishbone diagrams. Teams implement fixes within 48 hours.
Step 7: Update charts and monitor ongoing. Organisations review weekly in operations meetings.
Delivery occurs via case-based learning in group workshops. Assessments test chart interpretation, achieving 90% pass rates.
What Are the Key Components of Statistical Process Control Training?
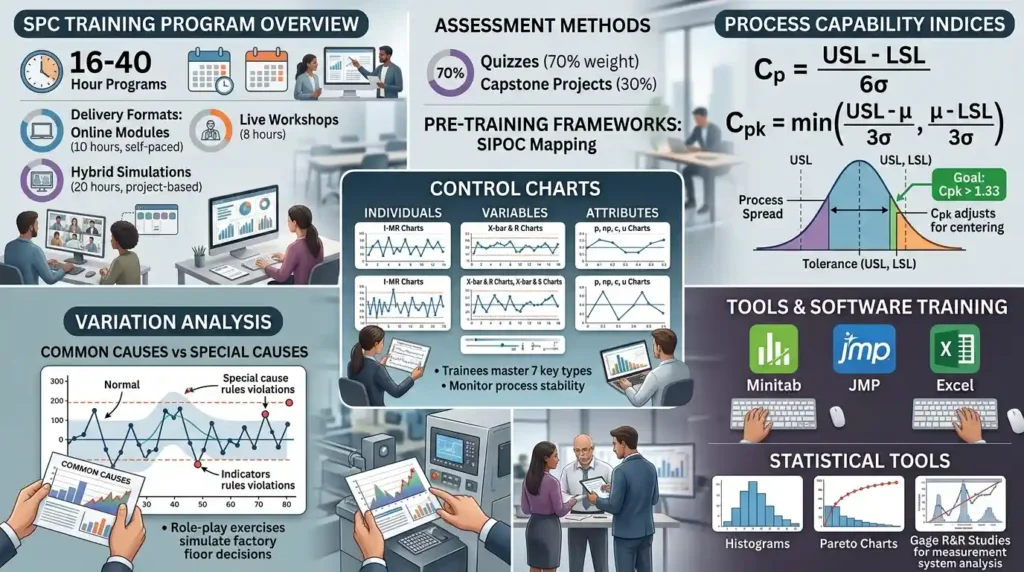
SPC training includes control charts, process capability indices, statistical software, variation analysis, and practical simulations delivered in 16-40 hour programs.
Control charts dominate: individuals (I-MR), variables (X-bar, S), and attributes (np, c). Trainees master seven types.
Process capability metrics feature prominently: Cp=6σUSL−LSL, Cpk adjusting for centering. Scores above 1.33 indicate capable processes.
Tools encompass histograms, Pareto charts, and Gage R&R studies for measurement system analysis. Software training covers Excel, Minitab, and JMP.
Variation analysis teaches common vs special causes, with role-play exercises simulating factory floor decisions.
Delivery formats mix online modules (self-paced, 10 hours), live workshops (8 hours), and hybrid simulations (project-based, 20 hours). Assessments include quizzes (70% weight) and capstone projects (30%).
Frameworks like SIPOC map processes pre-SPC. Learning methodologies emphasise hands-on application, filling skill gaps in 85% of participants.
What Challenges Do Organisations Face When Implementing Statistical Process Control?
Organisations encounter data quality issues, resistance to statistical methods, inadequate software integration, and misconceptions about universal applicability.
Data inaccuracies from poor sensors affect 40% of initial implementations. Teams train on validation protocols to resolve this.
Resistance arises when non-technical staff view SPC as overly complex. Training counters this with simplified visuals, boosting adoption by 60%.
Software silos hinder real-time monitoring. Integration with ERP systems like SAP resolves this, enabling dashboards.
Misconceptions include assuming SPC suits all processes service industries adapt it via transaction charts. Generic programs fail ROI, delivering only 10% improvement vs tailored ones at 25%.
Ineffective training skips simulations, leading to 30% lower retention. Lack of KPIs post-training obscures impact.
How Do Organisations Implement Statistical Process Control Training Effectively?
Organisations implement SPC training via needs assessment, pilot programs, full rollout, and continuous evaluation, achieving 20-35% defect reductions.
Assess skill gaps through audits, targeting 70% of quality teams. Duration: 2 weeks.
Pilot with 10-20 participants in workshops, measuring pre-post capability scores.
Roll out enterprise-wide using hybrid learning: 60% online, 40% in-person. Budget: £5,000-£15,000 per cohort of 25.
Integrate into Six Sigma belts: Green Belts master basics, Black Belts advanced modelling. Track via dashboards.
Sustain with refresher modules quarterly. Leadership sponsors ensure 90% completion rates.
For deeper implementation in advanced Six Sigma roles, explore:
How Master Black Belt training covers statistical analysis and data modelling. This bridges awareness to evaluating expert-level programmes.
For more information enrol:
Lean Six Sigma Master Black Belt Certification Training Course
What Measurable Outcomes Does Statistical Process Control Produce in Businesses?
SPC delivers 20-40% defect reductions, 15-30% productivity gains, 10-25% cost savings, and 85-95% process stability rates.
Defect rates drop from 5% to 1% within six months, per ASQ benchmarks. KPIs include DPMO (defects per million opportunities) falling below 3.4.
Productivity rises as cycle times shorten by 25%. First-pass yield improves to 95%.
Cost savings stem from 20% less scrap and rework. ROI hits 300-500% in year one.
Retention climbs 15% as teams gain confidence in data-driven decisions. Organisational impact includes stronger leadership pipelines via certified belts.
What Industries and Use Cases Demonstrate Statistical Process Control Success?
SPC succeeds in manufacturing (defect reduction), healthcare (patient wait times), finance (transaction errors), and IT (software deployment stability).
In automotive, Ford uses X-bar charts to cut assembly variations by 28%, serving 2 million vehicles yearly.
Healthcare applies c-charts to track infection rates, reducing incidents by 35% in NHS trusts.
Finance employs p-charts for error detection in transaction processing, achieving 99.9% accuracy at Barclays.
IT deploys SPC for server uptime, stabilising at 99.99% in data centres.
Corporate teams: Quality departments run daily charts. Managers lead DMAIC projects. Operations implement real-time SPC via IoT.
What Role Does Statistical Process Control Play in Six Sigma Certification Pathways?
SPC anchors Six Sigma certifications, progressing from Yellow Belt basics to Master Black Belt advanced modelling for enterprise transformation.
Yellow Belts learn basic charts in 16-hour courses. Green Belts apply in projects, analysing 50+ datasets.
Black Belts master capability studies and DOE integration. Master Black Belts design SPC systems, training 100+ staff annually.
Programmes span 40-160 hours, with 80% practical components. Pass rates hit 92% with simulations.
Organisations build pipelines: 20% of trainees advance belts yearly, enhancing retention by 18%.
How Does Statistical Process Control Address Common Training Misconceptions?
SPC training overcomes misconceptions by proving its adaptability, ROI through KPIs, specificity over generics, and simplicity via visuals.
Myth: SPC limits to manufacturing. Reality: Service adaptations yield 22% efficiency in call centres.
Myth: No ROI. Data shows 4:1 returns, tracked via sigma levels.
Myth: Too generic. Tailored programs match industry KPIs, unlike off-shelf ones with 12% uptake.
Myth: Overly complex. Visual charts and 4-hour intros achieve 88% comprehension.
Discover More from Our Guide Library:
How Does Lean Six Sigma Help Organisations Cut Costs Without Cutting Quality?
What Problems Does Lean Six Sigma Solve in Manufacturing and Service Sectors?
Practical simulations debunk these, focusing on real-world KPIs like OEE (overall equipment effectiveness) rising 15-20%.
What is covered in the Lean Six Sigma Master Black Belt Certification Training Course at Imperial Corporate Training Institute?
The course covers advanced DMAIC methodologies, statistical analysis, data modelling, and leadership in process improvement. Participants master tools like Design of Experiments (DOE), hypothesis testing, and enterprise-wide deployment strategies. Training includes simulations and case studies from industries like manufacturing and healthcare.
How long does the Lean Six Sigma Master Black Belt Certification Training Course take at Imperial Corporate Training Institute?
The programme spans 160-200 hours, delivered over 4-6 months in hybrid format with online modules and workshops. It features practical projects and assessments to ensure real-world application. Certification requires passing a comprehensive exam with a 85% threshold.
What are the prerequisites for the Lean Six Sigma Master Black Belt Certification Training Course from Imperial Corporate Training Institute?
Candidates need Black Belt certification and 3-5 years of Six Sigma project experience. Familiarity with SPC, Minitab, and basic statistics is essential. Imperial Corporate Training Institute assesses readiness via a pre-course evaluation.
How does Lean Six Sigma Master Black Belt training benefit organisations?
It equips leaders to drive 20-40% process improvements and £100,000+ savings per project. Teams gain skills in scaling Six Sigma across departments, boosting ROI and efficiency. Imperial Corporate Training Institute focuses on measurable outcomes like sigma level advancements.