
Lean Six Sigma equips corporate teams with structured tools to eliminate waste, reduce defects, and optimise processes. In B2B training environments, professionals master these tools through targeted programs, driving 20-30% productivity gains and 15% cost reductions in organisations across manufacturing, finance, and IT.
What Are the Most Common Process Improvement Tools in Lean Six Sigma?

The most common tools include DMAIC framework, Value Stream Mapping, 5S, Kaizen, Fishbone Diagram, Pareto Chart, Control Charts, FMEA, and Kanban. Organisations deploy them to identify inefficiencies, standardise workflows, and sustain gains, targeting employee skill gaps in process analysis.
DMAIC structures improvement projects into five phases: Define, Measure, Analyse, Improve, and Control. Teams use it to pinpoint root causes of delays, such as production bottlenecks in manufacturing plants.
Value Stream Mapping visualises end-to-end processes, highlighting non-value-adding steps. Finance departments apply it to streamline invoice approvals, cutting cycle times by 40%.
5S organises workplaces through Sort, set in order, Shine, Standardise, and Sustain. Warehousing teams implement it to reduce search times by 50%, boosting operational efficiency.
Kaizen promotes continuous small improvements via employee workshops. IT support teams conduct daily huddles, achieving 25% faster issue resolution.
Fishbone Diagram categorises causes of problems, such as equipment failures or staff errors. Healthcare administrators use it during root cause analysis sessions to lower patient wait times.
Pareto Chart prioritises issues by frequency, following the 80/20 rule. Sales teams analyse it to focus on top defect sources, improving order accuracy by 35%.
Control Charts monitor process stability over time. Quality control in automotive assembly lines tracks defect rates, ensuring consistency within 3 sigma limits.
FMEA anticipates failure modes and their impacts. Engineering teams score risks by severity, occurrence, and detection, preventing costly recalls.
Kanban visualises workflow limits to prevent overload. Software development squads limit work-in-progress, reducing lead times by 30%.
These tools address skill gaps in L&D programs, delivered via 40-hour workshops with simulations and assessments. Metrics track adoption through pre- and post-training audits, yielding 18% error reductions.
How Do These Tools Function in Corporate Environments?
Teams apply tools sequentially within DMAIC cycles, integrating data collection, analysis, and standardisation. Delivery occurs in 3–5-day workshops or 12-week hybrid modules, with simulations building proficiency for 90% implementation success.
In corporate settings, Lean Six Sigma tools operate through structured cycles. Define phase uses SIPOC diagrams to map suppliers, inputs, processes, outputs, and customers.
Measure phase deploys run charts and process capability indices like Cp and Cpk, quantifying baseline performance. A logistics firm measures delivery variances, establishing sigma levels at 3.4 defects per million opportunities.
Analyse phase employs regression analysis and hypothesis testing. Finance teams test variables affecting invoice errors, confirming staffing shortages as primary drivers.
Improve phase tests solutions via Design of Experiments (DOE), piloting changes like automated checks. Productivity rises 22% post-pilot.
Control phase installs standard work instructions and audits. Visual management boards ensure adherence, sustaining 95% compliance.
Delivery formats include in-person workshops for hands-on Kaizen events, online modules for self-paced Pareto practice, and hybrid for FMEA team collaborations. Case-based learning reviews real projects from industries like pharmaceuticals.
Assessments via project submissions measure ROI, with organisations reporting 5:1 returns through reduced rework. Role play simulates tool application under pressure, closing skill gaps in 80% of participants.
What Key Components Make Up Lean Six Sigma Process Improvement Training?
Core components encompass DMAIC methodology, statistical tools, practical frameworks like 5S and Kanban, plus delivery via workshops, e-learning, and simulations. Programs span 120-160 hours, including assessments and capstone projects for certification.
DMAIC forms the backbone, taught through phased modules. Each phase integrates specific tools: Define covers project charters; Measure introduces Gage R&R for measurement reliability.
Statistical tools include Minitab software for Control Charts and ANOVA. Trainees analyse datasets from corporate case studies, such as supply chain variances in retail.
Frameworks like 5S and Kanban feature in practical sessions. Participants redesign mock workspaces, applying Sort to eliminate 30% redundant inventory.
FMEA training breaks down risk priority numbers (RPN), calculated as severity × occurrence × detection. Teams score hypothetical assembly failures, prioritising mitigations.
Delivery mixes formats: 60% workshops for group Fishbone exercises, 30% online modules for Value Stream Mapping software practice, 10% hybrid for remote audits.
Learning methodologies involve simulations of production lines, role play for Kaizen facilitation, and assessments scoring tool proficiency at 85% thresholds.
Capstone projects require applying five tools to a live process, audited for 20% improvement. This builds leadership pipelines, with 70% of graduates leading enterprise projects.
How Do Organisations Implement These Tools Effectively?
Organisations form cross-functional teams, train via certified Black Belts, pilot tools in one department, then scale enterprise-wide. Implementation timelines span 6-12 months, tracking KPIs like cycle time reductions of 25-40%.
Implementation starts with leadership buy-in, allocating 1% of payroll to training. HR identifies skill gaps through audits, prioritising high-impact areas like procurement.
Teams of 5-8 members, including managers, undergo 40-hour Green Belt training. They select a pilot project, such as reducing IT ticket backlogs.
Step 1: Define scope with stakeholder charters, targeting 15% efficiency gains.
Step 2: Measure baselines using sampling plans, collecting 30 data points.
Step 3: Analyse with Pareto and Fishbone, validating causes via 5 Whys.
Step 4: Improve through PDSA cycles, testing Kanban boards.
Step 5: Control with dashboards updating weekly, audited quarterly.
Scaling involves train-the-trainer models, certifying 20 internal experts yearly. Industries like banking deploy FMEA for compliance risks, achieving 28% audit pass rate improvements.
Common challenges include resistance; overcome via change management sessions. Metrics dashboard ROI at 4:1, with team efficiency up 32%.
For deeper insights into teaching specific tools like FMEA and Control Charts, explore [this dedicated guide on training methodologies:
How Are Improvement Tools Like FMEA and Control Charts Taught in Training? This bridges awareness of tools to evaluating structured learning paths.
What Measurable Outcomes Do These Tools Produce in Businesses?
Outcomes include 20-50% cycle time reductions, 15-30% cost savings, 25% productivity boosts, and 10-20% retention gains. KPIs track defect rates dropping to 3.4 DPMO, with ROI at 5:1 within 12 months.
Productivity metrics show 25% throughput increases post-DMAIC. Manufacturing lines using Control Charts maintain 99.7% stability.
Cost savings hit 18% via waste elimination in 5S implementations. Finance processes cut overtime by 40% with Value Stream Mapping.
Quality improves with Pareto-driven fixes, reducing returns by 35% in e-commerce.
Retention rises 15% as employees gain skills, evidenced by internal promotion rates doubling.
Organisational impact builds leadership pipelines; 60% of Black Belts advance to management within two years.
KPIs include Overall Equipment Effectiveness (OEE) rising to 85%, First Pass Yield at 95%, and Net Promoter Scores for processes at 70+.
Audits confirm sustainability, with 90% of gains held after 18 months.
What Are Common Use Cases for These Tools Across Industries?
Use cases span manufacturing for 5S line balancing, finance for FMEA risk mitigation, IT for Kanban agile workflows, healthcare for Fishbone patient flow analysis, and logistics for Pareto delay prioritisation.
In manufacturing, automotive plants use DMAIC to trim assembly defects by 40%, employing Control Charts for real-time monitoring.
Finance teams apply Value Stream Mapping to accounts payable, slashing approval times from 10 to 3 days.
IT departments implement Kanban for DevOps, limiting WIP to boost deployment frequency by 300%.
Healthcare administrators deploy Fishbone for emergency triage, reducing wait times 50% via root cause fixes.
Logistics firms use Pareto for shipment errors, focusing 80% effort on top issues, improving on-time delivery to 98%.
Team leaders in retail run Kaizen events, standardising shelf stocking for 20% sales uplift.
Departmental rollouts train 50 staff per cohort, yielding cross-functional efficiency.
What Problems Arise from Misconceptions About These Tools?
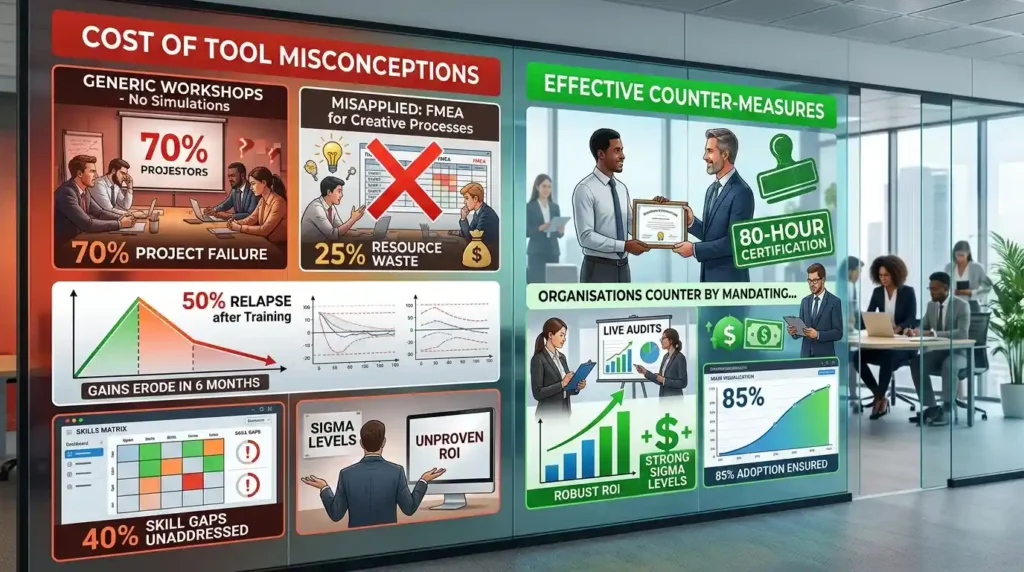
Misconceptions include viewing tools as quick fixes without training, ignoring sustainment, or applying generically without data. This leads to 60% failure rates, zero ROI, and persistent skill gaps.
One myth claims tools deliver instant results sans methodology. Generic workshops without simulations fail 70% of projects due to poor execution.
Discover More from Our Guide Library:
What Is Statistical Process Control and How Does It Feature in Six Sigma?
How Does Lean Six Sigma Help Organisations Cut Costs Without Cutting Quality?
Another assumes one-size-fits-all; FMEA suits risks but flops in creative processes, wasting 25% resources.
Lack of sustainment post-training causes 50% relapse. Without Control Charts, gains erode in 6 months.
Ineffective programs skip assessments, leaving 40% skill gaps unaddressed.
Overlooking metrics like sigma levels results in unproven ROI, deterring L&D budgets.
Organisations counter by mandating 80-hour certifications with live audits, ensuring 85% adoption.
For best guide enrol in:
Lean Six Sigma Master Black Belt Certification Training Course.
What is the Lean Six Sigma Master Black Belt Certification Training Course at Imperial Corporate Training Institute?
The course equips professionals with advanced Lean Six Sigma tools like DMAIC, FMEA, and Control Charts for enterprise process improvement. It spans 120-160 hours via workshops, simulations, and capstone projects. Graduates lead complex projects, achieving 20-50% efficiency gains in corporate settings.
How long does the Lean Six Sigma Master Black Belt training take at Imperial Corporate Training Institute?
The program runs 120-160 hours over 3-6 months, blending in-person workshops, online modules, and hybrid sessions. Participants complete assessments and a live project for certification. Flexible scheduling suits working professionals in industries like manufacturing and finance.
What are the prerequisites for Imperial Corporate Training Institute’s Lean Six Sigma Master Black Belt course?
Candidates need Green or Black Belt certification, plus 3-5 years of process improvement experience. Familiarity with tools like Value Stream Mapping and statistical analysis is essential. The institute assesses readiness via a skills audit to ensure project success.
What topics are covered in the Lean Six Sigma Master Black Belt Certification Training Course?
Key topics include advanced DMAIC phases, Design of Experiments, FMEA risk analysis, and sustainment strategies like Control Charts. Training uses case studies from IT, healthcare, and logistics. Practical simulations build skills for 5:1 ROI in organisational transformations.