

Data-driven strategic decision-making is the systematic practice of using factual analytics, quantitative metrics, and structured evidence rather than intuition to guide long-term business choices, align operational objectives, optimize resource allocation, and lower strategic exposure across corporate functions.
Defining Strategic Data Usage in the Corporate Context
Data-driven strategic decision-making transforms raw enterprise data into actionable business intelligence. Organisations collect high-volume datasets across internal operations and external markets. Executive leadership and department heads analyze these inputs to evaluate commercial opportunities, identify operational bottlenecks, and forecast market demand.
In modern enterprise environments, data utilization spans every functional area. Financial controllers use predictive models to project revenue streams and capital expenditure risks. Operations directors apply descriptive analytics to optimize supply chain routes and reduce inventory holding costs. HR leaders analyze workforce metrics to reduce voluntary turnover rates and map skill gaps across technical teams.
The Role of Business Intelligence in Workforce Alignment
Data serves as the baseline for cross-departmental alignment. When leadership establishes quantitative benchmarks, teams work toward measurable targets. Business intelligence dashboards consolidate key performance indicators (KPIs) into real-time visual reports.
Enterprise alignment depends on data literacy across management levels. Middle managers must interpret visual datasets, identify underlying operational variance, and convert findings into daily workflow adjustments. Without baseline data capabilities, management teams risk making fragmented choices that conflict with overall corporate objectives.
Why Do Organisations Face Challenges When Adopting Data-Driven Strategies?
Organisations struggle with data adoption due to persistent employee skill gaps, fragmented legacy software systems, poor data governance, and an entrenched organizational culture that prioritizes historical executive intuition over empirical, structured data insights.
Addressing Skill Gaps Across Management Levels
The most significant barrier to enterprise data adoption is the skill deficit among line managers and senior leaders. Many executives possess deep domain experience but lack formal training in statistical interpretation, data visualization, and predictive modeling.
This gap creates a reliance on central business intelligence teams. Line managers wait days for custom data reports rather than performing ad-hoc analysis independently. This structural bottleneck slows operational response times and degrades decision quality across mid-level management.
Overcoming Technical and Structural Silos
Enterprise data often remains trapped within disconnected business systems across enterprise resource planning (ERP) platforms, customer relationship management (CRM) software, and human resource information systems (HRIS). Unintegrated databases force teams to make strategic choices using incomplete information.
Poor data governance worsens structural integration issues. Inconsistent data entries, duplicate customer records, and outdated inventory metrics corrupt corporate reporting. Teams waste working hours manually reconciling conflicting spreadsheets rather than analyzing operational trends.
Eliminating Reliance on Historical Intuition
Legacy corporate cultures rely heavily on executive instinct. Experienced leaders often trust past personal successes over current statistical trends. This habit creates resistance when empirical data contradicts long-standing business models.
Overcoming cultural resistance requires systematic workforce development. Organisations must transition from subjective decision-making to evidence-based management. This cultural shift occurs when leadership mandates quantitative justification for capital expenditure requests, project charters, and strategic initiatives.
How Do Organisations Build Strategic Data Competencies Through Training?
Organisations construct strategic data competencies by executing structured learning programs that combine technical tool instruction, data governance frameworks, business scenario interpretation, case-based analysis, and practical simulation exercises tailored to executive workflows.
Phase 1: Conducting Comprehensive Skill Gap Assessments
The capability development process begins with an audit of organizational data literacy. Learning and development (L&D) professionals evaluate managers across key competencies, including data extraction, statistical interpretation, data visualization, and ethical data handling.
Skill gap assessments establish baseline performance metrics for every leadership tier. L&D leaders use these findings to design targeted learning paths that match specific job functions.
| Leadership Tier | Core Data Competencies Required | Primary Training Focus |
| Operational Managers | Data cleaning, dashboard navigation, basic SQL | Daily workflow optimization & error identification |
| Department Heads | Trend analysis, cohort tracking, KPI formulation | Cross-functional performance & resource allocation |
| Senior Executives | Predictive model evaluation, risk probability, scenario testing | Long-term capital allocation & market entry strategy |
Phase 2: Structural Curriculum Design and Instructional Delivery
Effective corporate training programs follow a structured progression from foundational concepts to advanced strategic application. Training models span intensive 2-day executive workshops, 6-week blended learning modules, and 12-week immersive hybrid programs.
1.Foundational Data Literacy & Hygiene:Duration: Weeks 1–2.
Focuses on understanding data architectures, database querying, data validation, and basic statistical measures.
2.Analytical Tools & Dashboard Masterclass:Duration: Weeks 3–5.
Provides hands-on instruction in platform operations, dashboard building, and data transformation techniques.
3.Strategic Interpretation & Business Application:Duration: Weeks 6–8.
Teaches managers how to translate quantitative outputs into operational strategy and financial projections.
4.Executive Presentation & Storytelling:Duration: Weeks 9–10.
Focuses on communicating analytical findings clearly to executive boards, stakeholders, and external partners.
5.Applied Capstone Project Evaluation:Duration: Weeks 11–12.
Requires participants to solve an active organizational business challenge using company data sets under expert guidance.
Phase 3: Active Learning Methodologies and Real-World Application
Theoretical instruction alone does not change executive behavior. Corporate training must incorporate active learning methodologies that mirror actual workplace conditions.
- Case-Based Learning: Participants analyze historical enterprise datasets from industries like IT, healthcare, finance, manufacturing, and logistics to diagnose strategic failures and identify growth opportunities.
- Business Simulations: Interactive digital models allow leadership teams to test strategic decisions under synthetic market conditions, evaluating financial impacts in real time without exposure to commercial risk.
- Role-Play Exercises: Managers practice presenting data-backed business proposals to simulated executive boards, learning to defend analytical methodologies and manage stakeholder objections.
- Structured Assessments: Formative quizzes and summative practical evaluations measure skill acquisition and ensure participants meet defined operational competency standards before course completion.
When evaluating external executive development programs, decision-makers often seek structured curricula designed to accelerate leadership capabilities. Exploring a data-driven strategy course provides valuable insight into how structured learning frameworks prepare senior leadership teams to convert complex operational datasets into clear corporate initiatives.
What Key Components Form an Effective Enterprise Data Strategy Framework?
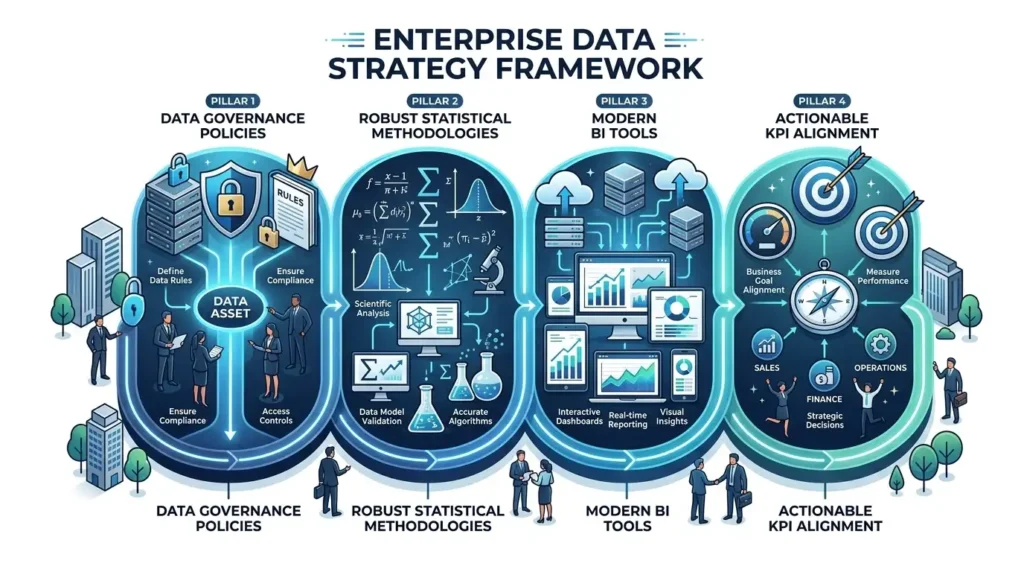
An effective enterprise data strategy framework consists of four core pillars: clear data governance policies, modern business intelligence tools, robust statistical methodologies, and actionable key performance indicator (KPI) alignment across all business functions.
Data Governance and Architecture
Data governance provides the operational rules, roles, and standards required to maintain data integrity across the enterprise. Without strict governance, data analysis leads to inaccurate business conclusions.
Governance frameworks define ownership for every dataset. Data stewards monitor data entry quality, enforce privacy compliance protocols under international regulations, and secure database access permissions. Clear governance ensures that leadership teams make decisions using accurate, audited, and secure information.
Modern Business Intelligence Software and Infrastructure
Enterprise analytics relies on specialized software tools. Modern infrastructure combines central cloud data warehouses, automated extraction tools, and user-friendly visualization platforms.
Core Analytical Methodologies
Organisations apply four distinct levels of analytics to evaluate commercial operations:
- Descriptive Analytics: Evaluates historical data to answer what happened within a specific business unit during a defined financial period.
- Diagnostic Analytics: Examines data anomalies and correlations to explain why specific business outcomes occurred.
- Predictive Analytics: Applies statistical modeling and machine learning algorithms to forecast future operational outcomes and market trends.
- Prescriptive Analytics: Recommends specific operational actions based on optimization models to capitalize on upcoming business opportunities.
Key Performance Indicator (KPI) Structural Alignment
Data strategies must map analytical outputs directly to corporate business goals. Departmental KPIs serve as the bridge between strategic goals and daily operational management.
Leadership teams must select leading indicators that predict future performance alongside lagging indicators that measure past outcomes. For example, monitoring employee training completion rates (leading) helps forecast long-term operational error reductions and customer satisfaction improvements (lagging).
How Do Different Corporate Departments Apply Data to Drive Performance?
Departments apply data analytics to solve specific functional challenges: Marketing optimizes acquisition costs, Operations streamlines inventory cycles, Finance models cash flows, and HR tracks workforce productivity and retention metrics.
Financial Planning and Risk Management
Finance departments use quantitative models to guide capital allocation decisions. Financial analysts evaluate investment proposals by running Monte Carlo simulations to assess risk probability across market conditions.
Predictive cash flow models help finance leaders manage working capital requirements. By analyzing customer payment cycles, seasonal demand fluctuations, and macroeconomic indicators, financial controllers reduce bad debt write-offs and optimize treasury operations.
Supply Chain and Operational Logistics
Operations teams in industries like manufacturing, retail, and logistics rely on real-time data to maintain efficiency. Sensor data from factory equipment powers predictive maintenance programs, reducing unplanned machinery downtime by up to 30%.
Supply chain managers use route optimization algorithms and demand-forecasting tools to minimize inventory holding costs. Real-time tracking allows operations leaders to adjust logistics schedules dynamically when port congestion or transport disruptions occur.
Human Resources and Workforce Development
Modern HR teams use people analytics to improve workforce productivity and retain key talent. By analyzing employee exit surveys, engagement scores, and performance evaluation metrics, HR professionals identify early indicators of voluntary turnover.
Learning and development leaders track training effectiveness through learning analytics. Measuring skill gains and post-training performance metrics enables L&D managers to optimize course content, select efficient delivery formats, and demonstrate clear training return on investment (ROI).
What Measurable Business Outcomes Does Strategic Data Adoption Produce?
Strategic data adoption produces measurable business outcomes, including increased operational productivity, improved profit margins, reduced voluntary staff turnover, accelerated time-to-market for new products, and higher return on capital expenditure investments.
Quantitative Productivity and Financial Gains
Organisations that build strong data competencies achieve superior financial and operational metrics compared to instinct-driven competitors. Research across industries indicates that data-driven enterprises record measurable performance gains.
- Productivity Growth: Structured operational analytics delivers a 15% to 22% increase in overall workforce productivity within 12 months of implementation.
- Operating Margins: Companies using predictive analytics improve operating margins by 6% to 10% through supply chain optimization and reduced waste.
- Project Delivery Success: Data-driven project management frameworks increase on-time completion rates from 45% to over 78%.
Talent Retention and Leadership Pipeline Strength
Investing in management data literacy directly impacts workforce retention and leadership development. Managers equipped with analytical skills make fairer, objective performance evaluations, leading to improved team satisfaction.
Structured learning paths create a steady pipeline of analytical leaders. Companies with formal data training programs report a 35% higher internal promotion rate for mid-level management roles, reducing expensive external recruitment needs.
What Misconceptions and Errors Impair Corporate Data Initiatives?
Common errors that impair corporate data initiatives include treating data adoption as an IT project rather than a cultural transition, buying expensive software without training staff, relying on generic non-industry programs, and failing to measure ROI.
Error 1: Viewing Data Strategy as an IT Department Responsibility
A common mistake executive teams make is assigning data adoption entirely to the IT department. IT teams manage technical infrastructure, database security, and software licensing. However, they rarely possess the operational domain knowledge required to translate business challenges into strategic analytical models.
Data strategies succeed only when operational business units own their analytical processes. Line managers must take responsibility for defining relevant business questions, interpreting dashboard outputs, and executing data-backed decisions.
Error 2: Software Acquisition Without Capability Training
Organisations often spend heavily on enterprise business intelligence platforms, assuming software deployment automatically creates a data-driven culture. Without comprehensive workforce training, expensive software tools end up underutilized, serving as basic spreadsheet replacements.
Capability development must match technology investment. Companies should dedicate at least 30% to 40% of their analytics transformation budgets directly to employee training, change management, and ongoing skill development programs.
Error 3: Relying on Generic, Off-the-Shelf Training Programs
Generic data training courses focused solely on software mechanics fail to deliver business outcomes. Off-the-shelf courses teach basic menu navigation and syntax, but skip practical business application, data storytelling, and strategic decision-making frameworks.
Effective corporate training must use real-world enterprise contexts. Practical programs incorporate company datasets, address industry-specific regulatory constraints, and solve real operational challenges facing the business.
Frequently Asked Questions
What is data-driven corporate training?
Data-driven corporate training is a practical capability development model designed by providers like Imperial Corporate Training Institute to help managers interpret analytics, eliminate gut-based decision-making, and convert complex enterprise datasets into actionable strategic growth initiatives
How do business decision-makers use data-driven strategy courses?
Senior leaders and business managers use data-driven strategy training to master quantitative forecasting, establish key performance indicators, optimize resource allocation, and enhance cross-departmental operational efficiency using real-world case studies and live analytics dashboards.
What are the primary benefits of data-driven leadership training for organisations?
Data-driven leadership programs enable organisations to bridge management skill gaps, lower capital investment risks, increase workforce productivity, and improve voluntary staff retention rates by establishing an objective, metric-based workplace culture.
How is a data-driven strategy course delivered to corporate teams?
Imperial Corporate Training Institute delivers data-driven strategy training through flexible formats, including intensive executive workshops, interactive online modules, and blended hybrid programs featuring business simulations, hands-on capstone projects, and real-time assessments.
How do organisations measure the return on investment of data-driven training?
Organisations evaluate data-driven training effectiveness by tracking key performance indicators such as project delivery velocity, operational error reduction, post-training productivity increases, and measurable financial margin improvements across participating business units.