
Organisations across industries such as manufacturing, healthcare, IT, and finance face recurring operational problems that affect productivity, quality, and customer satisfaction. Many organisations solve symptoms instead of addressing root causes, resulting in repeated defects, wasted resources, and inconsistent performance. The Fishbone Diagram provides a structured method for identifying and analysing the causes behind business problems.
A Fishbone Diagram plays a central role in Lean Six Sigma because it supports evidence-based decision-making and process improvement. Teams use it to investigate quality failures, process bottlenecks, customer complaints, and operational inefficiencies. In workforce development, professionals learn how to apply this tool through practical exercises, simulations, and structured problem-solving activities aligned with measurable business outcomes.
What is a Fishbone Diagram and why does it matter in business environments?
A Fishbone Diagram is a visual root cause analysis tool used to identify, categorise, and analyse factors contributing to a business problem, helping organisations improve quality, reduce defects, and increase operational efficiency through structured investigation.
The Fishbone Diagram, also known as the Ishikawa Diagram or Cause-and-Effect Diagram, was developed by Japanese quality expert Kaoru Ishikawa. It visually maps potential causes of a problem into categories that resemble the bones of a fish.
In business environments, organisations rarely experience problems caused by a single factor. Quality defects, customer dissatisfaction, delayed projects, and low productivity often result from multiple interconnected issues. The Fishbone Diagram helps teams systematically examine these relationships.
The “head” of the diagram represents the problem statement. The “bones” represent categories of causes. Teams brainstorm possible causes under each category and validate them using data.
This structured approach supports operational excellence initiatives because it shifts discussions from assumptions to evidence. Organisations that apply root cause analysis effectively reduce rework, improve service quality, and strengthen process reliability.
In corporate learning environments, employees develop analytical skills that support continuous improvement and cross-functional collaboration. These capabilities align with workforce transformation goals and strengthen organisational resilience.
How is a Fishbone Diagram used in Lean Six Sigma projects?

Lean Six Sigma teams use Fishbone Diagrams during problem-solving phases to identify root causes, prioritise corrective actions, and improve process performance using data-driven methodologies and measurable performance indicators.
Lean Six Sigma combines waste reduction principles from Lean with variation reduction techniques from Six Sigma. The Fishbone Diagram is commonly used during the Define, Measure, Analyse, Improve, and Control (DMAIC) framework, particularly in the Analyse phase.
Teams begin by clearly defining the problem. Examples include a 12% defect rate, customer complaints increasing by 20%, or production delays averaging 15 hours weekly.
Once the problem is defined, team members identify possible causes across different categories. They then collect evidence to verify which causes contribute most significantly to the issue.
For example, a manufacturing company experiencing high defect rates may discover that outdated equipment calibration, inconsistent operator training, and unclear work instructions collectively create quality failures.
Lean Six Sigma professionals rely on performance metrics such as:
Key performance indicators used during analysis
- Defect rate
- Cycle time
- First-pass yield
- Customer satisfaction score
- Process capability index (Cp and Cpk)
- Cost of poor quality
- Employee productivity metrics
By connecting causes to measurable outcomes, organisations improve process stability and increase operational efficiency.
How does a Fishbone Diagram work in corporate problem-solving processes?
A Fishbone Diagram works through structured root cause identification, collaborative analysis, data validation, and implementation of corrective actions that improve organisational performance and process effectiveness.
The process typically follows a structured sequence used in corporate improvement initiatives.
Step 1: Define the problem clearly
Teams create a measurable problem statement. Instead of writing “poor quality,” they specify “customer returns increased by 18% during Q2.”
Clear definitions support accurate analysis and prevent teams from investigating unrelated issues.
Step 2: Select cause categories
The traditional 6M categories used in manufacturing include:
- Manpower
- Methods
- Machines
- Materials
- Measurement
- Environment
Service organisations often adapt categories to suit operational needs.
Step 3: Brainstorm potential causes
Cross-functional teams identify possible contributing factors. Departments such as HR, operations, finance, and quality management provide different perspectives that improve analysis quality.
Step 4: Validate causes with data
Teams collect evidence using process data, audits, customer feedback, and performance reports. This prevents decisions based on assumptions.
Step 5: Implement improvements
Once root causes are confirmed, organisations develop corrective actions and monitor outcomes using predefined KPIs.
This systematic approach strengthens accountability and supports sustainable performance improvement.
What key components support effective Fishbone Diagram analysis?
Effective Fishbone Diagram analysis requires structured frameworks, analytical skills, cross-functional collaboration, data collection methods, and training delivery models that ensure practical application in workplace settings.
Root cause analysis depends on both technical tools and workforce capabilities.
Analytical frameworks
Fishbone Diagrams often work alongside complementary methodologies such as:
- 5 Whys analysis
- Pareto analysis
- Process mapping
- Failure Mode and Effects Analysis (FMEA)
- Statistical process control
Combining these methods increases diagnostic accuracy and improves decision-making.
Employee skills
Successful implementation requires competencies including:
- Critical thinking
- Data interpretation
- Process analysis
- Facilitation skills
- Collaborative problem-solving
Employee skill gaps in these areas reduce the effectiveness of continuous improvement initiatives.
Training delivery formats
Organisations deliver root cause analysis training through:
- Classroom workshops
- Virtual instructor-led training
- Online learning modules
- Hybrid learning programmes
- Case-based learning sessions
Training programmes often range from 16 to 80 hours depending on complexity and certification level.
Learning methodologies
Effective professional development uses:
- Simulations
- Real-world case studies
- Group exercises
- Role play scenarios
- Practical assessments
These methods improve knowledge retention and support workplace application.
What business benefits do organisations gain from using Fishbone Diagrams?
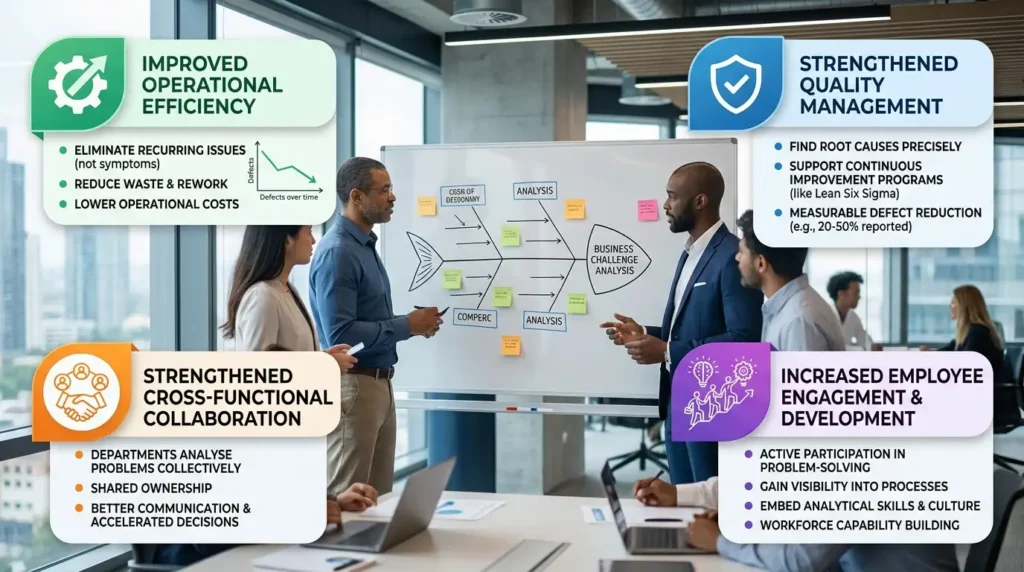
Organisations using Fishbone Diagrams improve operational efficiency, reduce waste, strengthen quality management, increase employee engagement, and generate measurable business outcomes across multiple functions.
Root cause analysis creates direct business value when integrated into continuous improvement programmes.
Quality improvement initiatives frequently produce measurable results. Organisations implementing structured Lean Six Sigma practices report reductions in process defects ranging from 20% to 50%, depending on process maturity and implementation scope.
Operational efficiency improves because teams eliminate recurring issues rather than repeatedly addressing symptoms. Reduced rework lowers costs and increases productivity.
Cross-functional collaboration strengthens because departments analyse problems collectively. Shared ownership improves communication and accelerates decision-making.
Employee engagement increases when staff actively participate in problem-solving initiatives. Teams gain greater visibility into organisational processes and understand how their work contributes to performance goals.
Workforce development also benefits because analytical skills become embedded within organisational culture, supporting long-term capability building and leadership development.
Which industries and departments use Fishbone Diagrams most effectively?
Fishbone Diagrams support decision-making across industries and departments by identifying root causes of operational challenges, improving quality outcomes, and strengthening continuous improvement efforts.
Different sectors apply Fishbone analysis to address specific challenges.
Manufacturing
Manufacturing organisations use Fishbone Diagrams to investigate equipment failures, defect rates, and production delays.
Healthcare
Hospitals analyse patient safety incidents, medication errors, and service inefficiencies.
Information technology
IT teams investigate system outages, cybersecurity incidents, and software defects.
Finance
Financial institutions examine compliance failures, transaction errors, and customer complaints.
Human resources
HR departments analyse employee turnover, absenteeism, and recruitment challenges.
Departmental applications include operations management, quality assurance, customer service, procurement, and supply chain management.
Cross-industry adoption demonstrates the flexibility of the tool and its relevance to modern workplace challenges.
What challenges prevent organisations from using Fishbone Diagrams effectively?
Organisations often fail to achieve results from Fishbone Diagrams because of poor data quality, insufficient training, unclear problem definitions, and lack of implementation discipline.
Many organisations treat root cause analysis as a one-time exercise instead of an ongoing capability.
A common mistake involves analysing vague problems without measurable definitions. Teams investigating “poor performance” often generate unclear conclusions because the problem lacks quantifiable indicators.
Another challenge is relying entirely on brainstorming without validating findings through evidence. Data-driven analysis remains essential for reliable decision-making.
Generic training programmes also limit effectiveness. Employees require practical learning experiences aligned with workplace scenarios and industry-specific challenges.
Leadership support significantly affects outcomes. Improvement initiatives succeed when leaders establish accountability, allocate resources, and monitor KPIs consistently.
As organisations expand continuous improvement capabilities, many professionals seek deeper understanding of advanced analytical techniques and deployment frameworks.
Readers exploring structured learning pathways can examine:
Cause-and-effect analysis in advanced Lean Six Sigma practice.
How is root cause analysis taught in professional development programmes?
Professional development programmes teach root cause analysis through practical exercises, real-world case studies, simulations, assessments, and project-based learning aligned with business objectives and performance metrics.
Modern workforce development prioritises application over theory.
Participants learn to define problems, build Fishbone Diagrams, collect evidence, interpret data, and recommend corrective actions. Training frequently includes real business scenarios to increase relevance and retention.
Learning pathways often progress through multiple levels of expertise, from introductory concepts to advanced statistical analysis and organisational transformation methodologies.
Discover More from Our Guide Library:
How Does Six Sigma Apply to Financial Services and Banking Operations?
What Are Gage Repeatability and Reproducibility Studies in Six Sigma?
Programmes supporting continuous improvement typically use blended learning approaches combining instructor-led sessions, digital modules, workshops, and workplace projects.
Advanced learning environments also integrate leadership competencies because successful process improvement requires stakeholder engagement, communication, and change management skills.
Within the context of a Lean Six Sigma Master Black Belt Certification Training Course, professionals develop enterprise-level capabilities for managing improvement programmes, mentoring teams, and aligning operational initiatives with strategic objectives.
Organisations investing in structured workforce development strengthen leadership pipelines, improve process maturity, and create cultures focused on measurable impact, collaboration, innovation, and sustained performance excellence.
Frequently Asked Questions
Who should attend a Lean Six Sigma Master Black Belt Certification Training Course?
This training is designed for senior quality professionals, operational leaders, consultants, and continuous improvement managers. It is suitable for individuals responsible for process optimisation, strategic projects, and organisational performance improvement.
What skills are developed in Lean Six Sigma Master Black Belt training?
Participants develop skills in DMAIC methodology, change management, root cause analysis, and advanced statistical tools. The training also strengthens leadership, coaching, and project governance capabilities.
How does Lean Six Sigma Master Black Belt certification benefit organisations?
Organisations use Lean Six Sigma methodologies to reduce defects, improve efficiency, and enhance customer satisfaction. Structured process improvement initiatives often lead to measurable gains in productivity and quality performance.
How is Lean Six Sigma Master Black Belt training delivered?
Training is commonly delivered through classroom workshops, virtual sessions, hybrid learning, and project-based assessments. Imperial Corporate Training Institute incorporates practical exercises and real-world business scenarios to support workplace application.